Loghowder is software om een webpagina te genereren van een HTTP logbestand. Deze pagina bevat een grafiek, filter voor requests en instellingen voor de weergave.
Installatie
Loghowder vereist Node.js om de pagina te genereren.
Je kunt de software, en meer informatie, vinden op GitHub.
Voorbeelden
Hierna volgen enkele voorbeelden van grafieken die Loghowder kan produceren. Deze afbeeldingen zijn gemaakt uit gegenereerde data, geen echt HTTP logbestand.
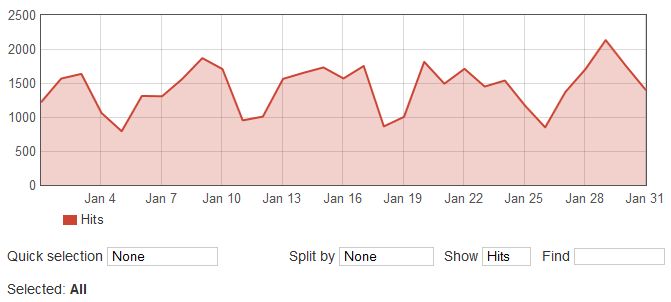
All hits
Deze grafiek zie je als je de pagina opent:
Hits split by client type
Hier zijn de hits gesplitst op client type:
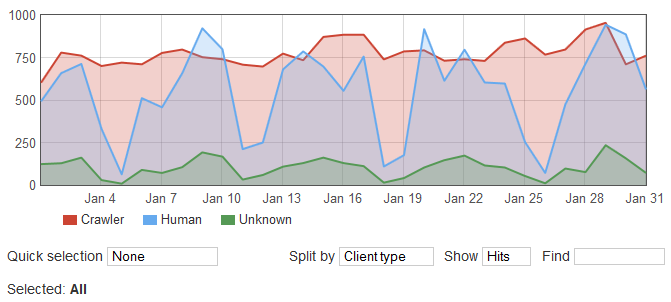
Client types worden bepaald uit de browserdata die meegestuurd wordt. Sommige bots doen zich voor als normale browsers waardoor ze hier geteld worden als menselijke bezoeker.
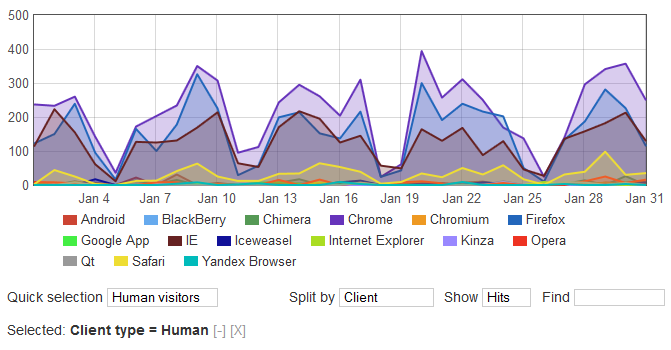
Human visitors split by browser
Door Human te selecteren en die te verdelen op Client zie je welke browsers gebruikt zijn:
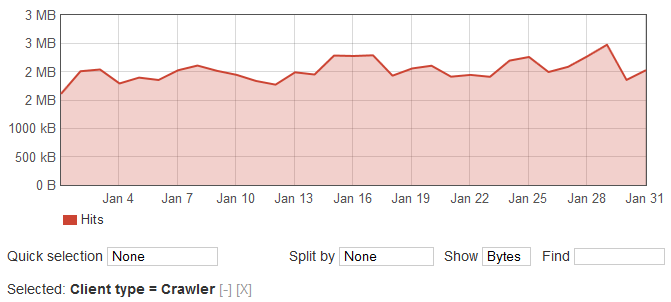
Bytes transferred by crawlers
Door Bytes te kiezen in plaats van Hits zie je hoeveel bytes verstuurd zijn. In dit geal alleen voor hits door crawlers:
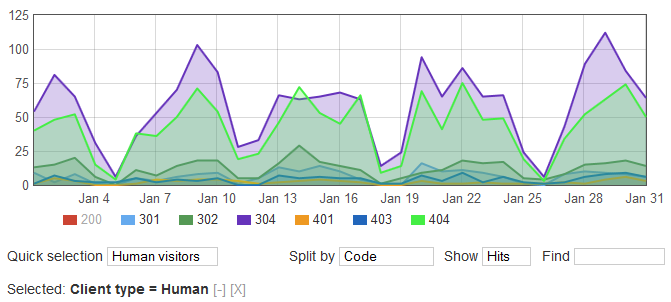
Hits split by HTTP status code, excluding 200
De series in de grapiek kun je verbergen. Hier zijn alle status codes zichtbaar behalve de waarde 200, oftewel OK:
